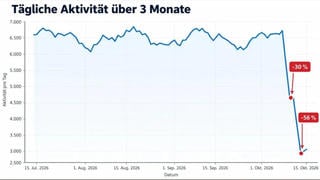
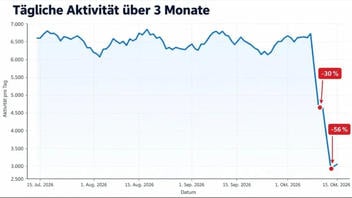
Does a chart show real data of the drop-off in far-right Alternative for Germany (AfD) bot activity since Ukraine bombed several Russian data centers? No, that's not true: This chart shows a prediction of the future, not a factual graph of what had already happened. The line graph, shared without sourcing on Oct. 11, 2026, shows a line going all the way to Oct. 15, 2026.
The claim appeared in a post (archived here) by the @robin_schlingheider account on Threads on Oct. 11, 2026. The automatic Threads translation from German read:
Glory to Ukraine and many thanks for that.
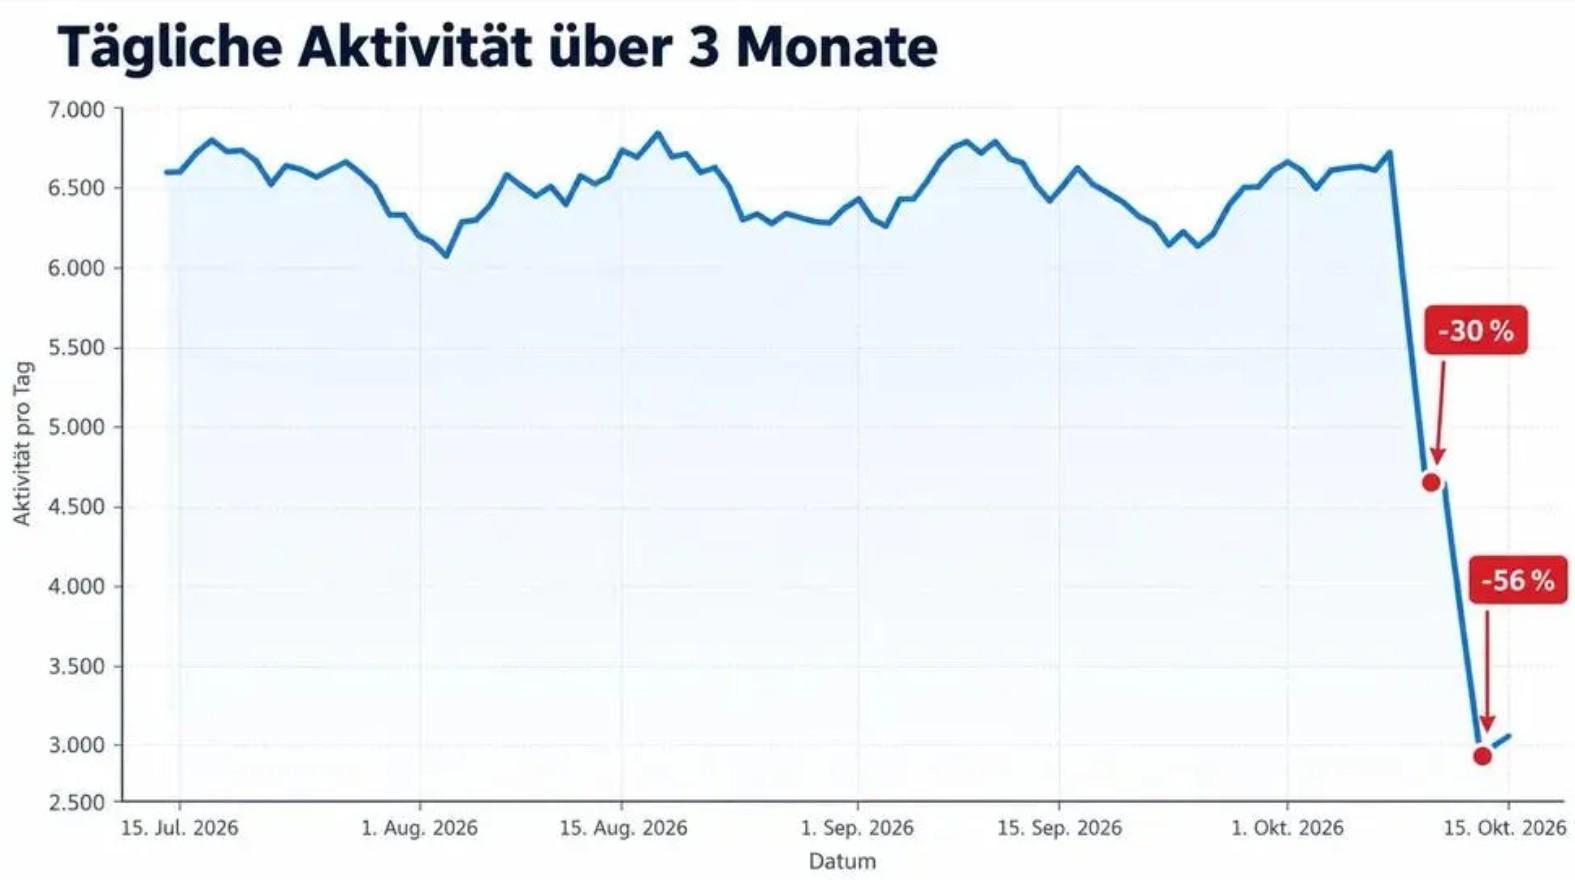
The German title of the graph translates to:
Daily activity over 3 months
This is what the post looked like on Threads at the time of writing:
(Image source: post by @robin_schlingheider on Threads.)
This graph is presented without a source and without a data citation. The importance of those two things is explained here by the University of Michigan Library (archived here).
This fact check does not verify specific numbers, past or future, or determine whether Russian bot activity has changed since these Ukrainian strikes began Oct. 8, 2026. The purpose of this fact check is to show that when the graph appeared, it showed four days into the future, which could not have been based on real data. Strikes on Russian data centers began on Oct. 8, 2026, as reported by NBC News (archived here). Many have taken the graph to be factual, though it is not.
The line graph shows a y-axis marked "Activity per day" but does not specify what a unit of activity is. The x-axis shows a timeline marked off in two-week increments. It can be hard to tell the exact date associated with the chart's information because of the large span between each date listed. The last date noted is Oct. 15, 2026. At the time of writing, Oct. 13, 2026, this is still two days in the future -- but this chart already documents the blue line of "activity" rebounding in the coming days.
Lead Stories took a portion of the graph between Oct. 1, 2026, and Oct. 15, 2026 (pictured below), and added a grid overlay to mark one-day increments. A green dot on the timeline represents the day the graph was posted on social media -- Oct. 11, 2026 -- and makes plain how much of the line graph is a fabricated prediction.
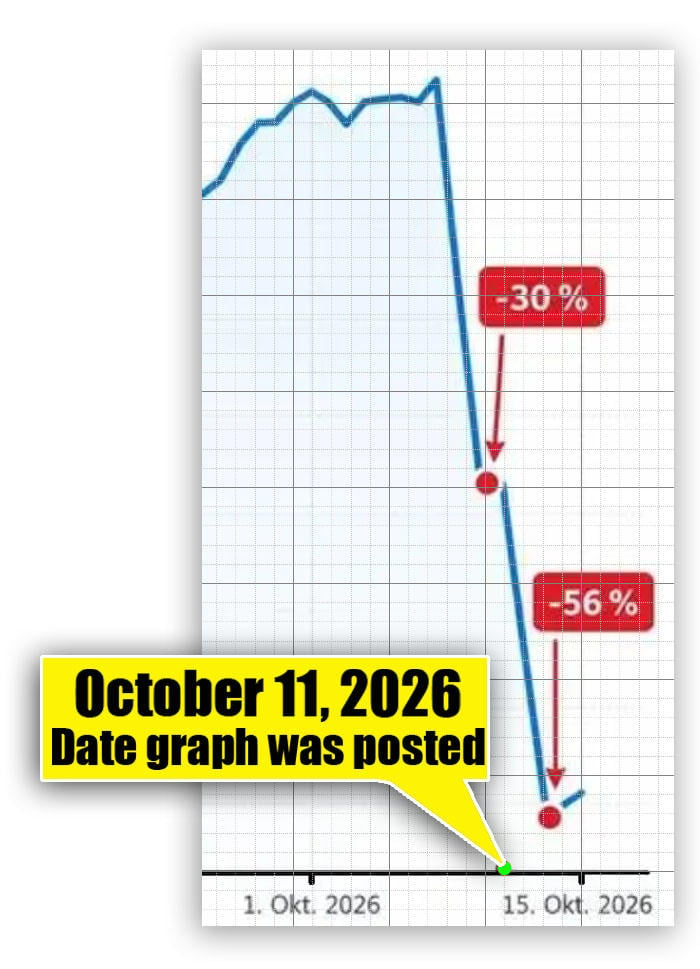
(Image source: Lead Stories markup of post by @robin_schlingheider on Threads.)
On Oct. 12, 2026, @robin_schlingheider wrote an update on Threads, apologizing for posting an unverified graph. The post linked to another post that is no longer available. The translation of the @robin_schlingheider post (archived here) reads:
I made a mistake in my post regarding the AfD bot. I took an unverified graph from the linked post, which turned out to be AI-generated. It then drew its own conclusions. (I can currently see this graph in the app.) I'm sorry about that and I will pay more attention to this in the future.
They were not the only person to publish this unverified graph. Also on Oct. 11, 2026, the graph was posted by Tomáš Zdechovský, a member of the European Parliament (archived here and embedded below).
If confirmed, this is telling: Russian data centres get hit, and online activity around AfD suddenly plummets. 📉 So much talk about German patriotism... then the connection from Russia goes down. 🤔🇷🇺
-- Tomáš Zdechovský (@TomasZdechovsky) October 11, 2026